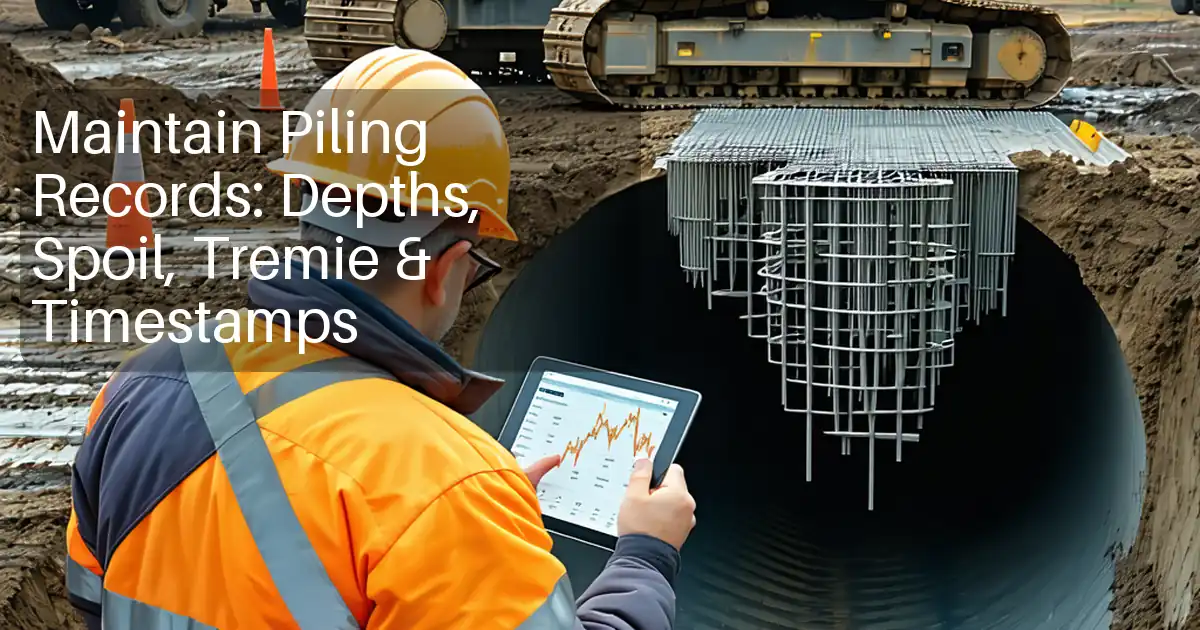
Substructure Lessons Learned Checklist for Retention and Groundwater
Definition: Substructure Lessons Learned Checklist guides construction teams to document retention performance, groundwater behavior, and actionable improvements for foundations, excluding blame analysis, so future design, sequencing, and monitoring decisions are better informed.
- Capture retention system outcomes with measurements, photos, plots, and approvals.
- Record groundwater head, inflow, turbidity, and dewatering uptime with evidence.
- Translate observations into specific, measurable improvement actions for next projects.
- Interactive, commentable checklist with export and QR code verification.
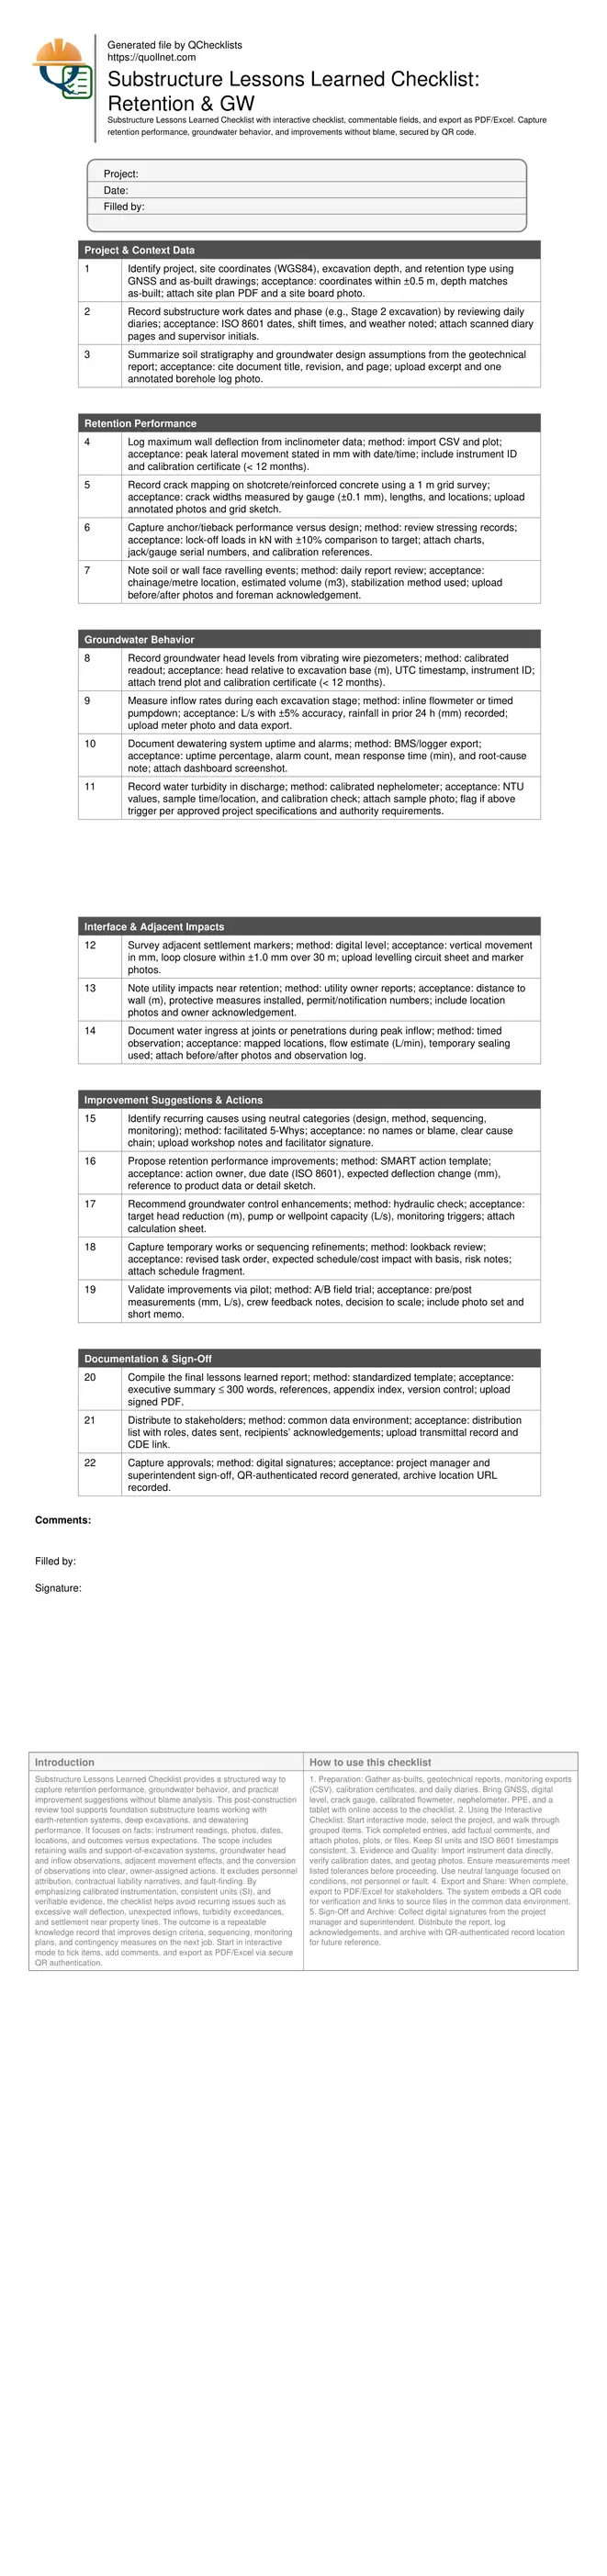
Substructure Lessons Learned Checklist provides a structured way to capture retention performance, groundwater behavior, and practical improvement suggestions without blame analysis. This post-construction review tool supports foundation substructure teams working with earth-retention systems, deep excavations, and dewatering performance. It focuses on facts: instrument readings, photos, dates, locations, and outcomes versus expectations. The scope includes retaining walls and support-of-excavation systems, groundwater head and inflow observations, adjacent movement effects, and the conversion of observations into clear, owner-assigned actions. It excludes personnel attribution, contractual liability narratives, and fault-finding. By emphasizing calibrated instrumentation, consistent units (SI), and verifiable evidence, the checklist helps avoid recurring issues such as excessive wall deflection, unexpected inflows, turbidity exceedances, and settlement near property lines. The outcome is a repeatable knowledge record that improves design criteria, sequencing, monitoring plans, and contingency measures on the next job. Start in interactive mode to tick items, add comments, and export as PDF/Excel via secure QR authentication.
- Create a concise, evidence-driven record of earth-retention performance and groundwater behavior using calibrated measurements, photos, and logs. Convert observations into prioritized, owner-assigned improvement actions that strengthen design assumptions, monitoring plans, and construction sequencing on the next substructure project.
- Interactive online checklist with tick, comment, and export features secured by QR code.
- Improve predictability by comparing inclinometer deflections, anchor loads, and settlement against expectations while correlating groundwater head levels, inflow rates, turbidity, and pump uptime. This correlation reveals root causes and practical mitigations without assigning blame or recording personal attributions.
- Standardize documentation across sites with consistent SI units, ISO 8601 timestamps, and QR-authenticated sign-off. The resulting dataset enables portfolio-level analysis, supports risk registers, and informs specification updates per approved project specifications and authority requirements.
Project & Context Data
Retention Performance
Groundwater Behavior
Interface & Adjacent Impacts
Improvement Suggestions & Actions
Documentation & Sign-Off
Documenting Retention System Performance with Measurable Evidence
Effective lessons learned start with measurable retention performance. Inclinometer trends show how lateral wall movements evolved compared with design predictions. Crack mapping on shotcrete or cast-in-place concrete reveals local overstress or shrinkage effects. Anchor stressing records document whether lock-off loads matched targets and stayed stable. These records must be tied to dates, excavation stages, and nearby activities to avoid misleading conclusions. Use calibrated instruments, consistent SI units, and clear plots to support repeatability. For example, a site recorded 18 mm peak deflection at EL −4.5 m, within tolerance, but noted localized ravelling after heavy rain; adding a drain strip behind lagging reduced incidents. When you write the narrative, focus on conditions and responses, not people. Attach photos taken perpendicular to the wall at consistent offsets for scale, and ensure EXIF timestamps match monitoring logs so future reviewers can correlate events and actions.
- Use calibrated instruments with certificates less than 12 months old.
- Correlate readings with excavation stage and weather events.
- Annotate photos with chainage/metre and crack widths in mm.
- Compare anchor loads to targets within a ±10% band.
- Keep narratives factual and free from personal attribution.
Capturing Groundwater Behavior Consistently Through the Excavation
Groundwater behavior often explains unexpected movements or delays. Record piezometric head relative to excavation base to compare stages and sites. Log inflow rates using a calibrated flowmeter or timed pumpdown, noting rainfall during the prior 24 hours to contextualize spikes. Include dewatering system uptime and alarm response times to highlight operational reliability. Turbidity measurements (NTU) demonstrate discharge quality and can reveal filter clogging or excavation fines disturbance. On one project, head remained 0.8 m above target near a corner; adding a supplementary wellpoint line cut head by 0.5 m and stabilized inflow. Pair every number with a timestamp, location, and instrument ID. Plot data to visualize trends, and record any control changes immediately before or after observed shifts so future teams can link causes and effects without conjecture.
- Measure head in metres with UTC timestamps and instrument IDs.
- Record inflow in L/s with ±5% meter accuracy.
- Log uptime percentage and alarm response time in minutes.
- Measure turbidity in NTU with calibration checks documented.
- Note rainfall depth (mm) for correlation with inflows.
Turning Observations into Blame-Free, Actionable Improvements
A lessons learned log only adds value when it becomes actionable change. Convert observations into specific improvements using a neutral taxonomy: design, method, sequencing, and monitoring. Draft each action as SMART: define the expected effect (e.g., reduce peak deflection by 5 mm), the method (e.g., add waler at EL −3.0 m), the owner, and the date. Quantify groundwater controls similarly, specifying target head reductions and pump capacities. Validate proposals with small trials and compare pre/post metrics. Keep the language free of personal attribution; focus on conditions, decisions, and measured outcomes. Close the loop with sign-offs, distribution through the common data environment, and archiving with QR authentication. This structure helps teams carry insights forward, reduces repeated issues, and provides traceable rationale for updating method statements and monitoring plans on subsequent projects.
- Classify causes neutrally: design, method, sequencing, monitoring.
- Write SMART actions with owners and ISO 8601 due dates.
- Quantify expected effects in mm, L/s, or m of head.
- Pilot improvements and compare pre/post measurements.
- Archive signed records with QR authentication.
How to Use This Interactive Checklist
- Preparation: Gather as-builts, geotechnical reports, monitoring exports (CSV), calibration certificates, and daily diaries. Bring GNSS, digital level, crack gauge, calibrated flowmeter, nephelometer, PPE, and a tablet with online access to the checklist.
- Using the Interactive Checklist: Start interactive mode, select the project, and walk through grouped items. Tick completed entries, add factual comments, and attach photos, plots, or files. Keep SI units and ISO 8601 timestamps consistent.
- Evidence and Quality: Import instrument data directly, verify calibration dates, and geotag photos. Ensure measurements meet listed tolerances before proceeding. Use neutral language focused on conditions, not personnel or fault.
- Export and Share: When complete, export to PDF/Excel for stakeholders. The system embeds a QR code for verification and links to source files in the common data environment.
- Sign-Off and Archive: Collect digital signatures from the project manager and superintendent. Distribute the report, log acknowledgements, and archive with QR-authenticated record location for future reference.
Call to Action
- Start Checklist Tick off tasks, leave comments on items or the whole form, and export your completed report to PDF or Excel—with a built-in QR code for authenticity.
- Download Excel - Substructure Lessons Learned Checklist
- Download PDF - Substructure Lessons Learned Checklist
- View Image - Substructure Lessons Learned Checklist
Cite & Embed
“Substructure Lessons Learned Checklist by Quollnet”
with a link to
this source page.
FAQ
Question: When should we complete the substructure lessons learned review?
Question: What evidence is sufficient to support conclusions without blame analysis?
Question: How can we quantify groundwater behavior for meaningful comparison?
Question: Who should sign off the lessons learned and how are they archived?
Question: How do we turn observations into practical, trackable improvements?
Related Articles
Broader reading and guidance connected to this checklist topic.

Retention In Construction: Formulas, Bonds & Accounting Guide

Is It Important To Customize Your Qr Code And How To Do It?

Related Checklists
Keep the workflow moving with nearby templates chosen from similar checklist content.