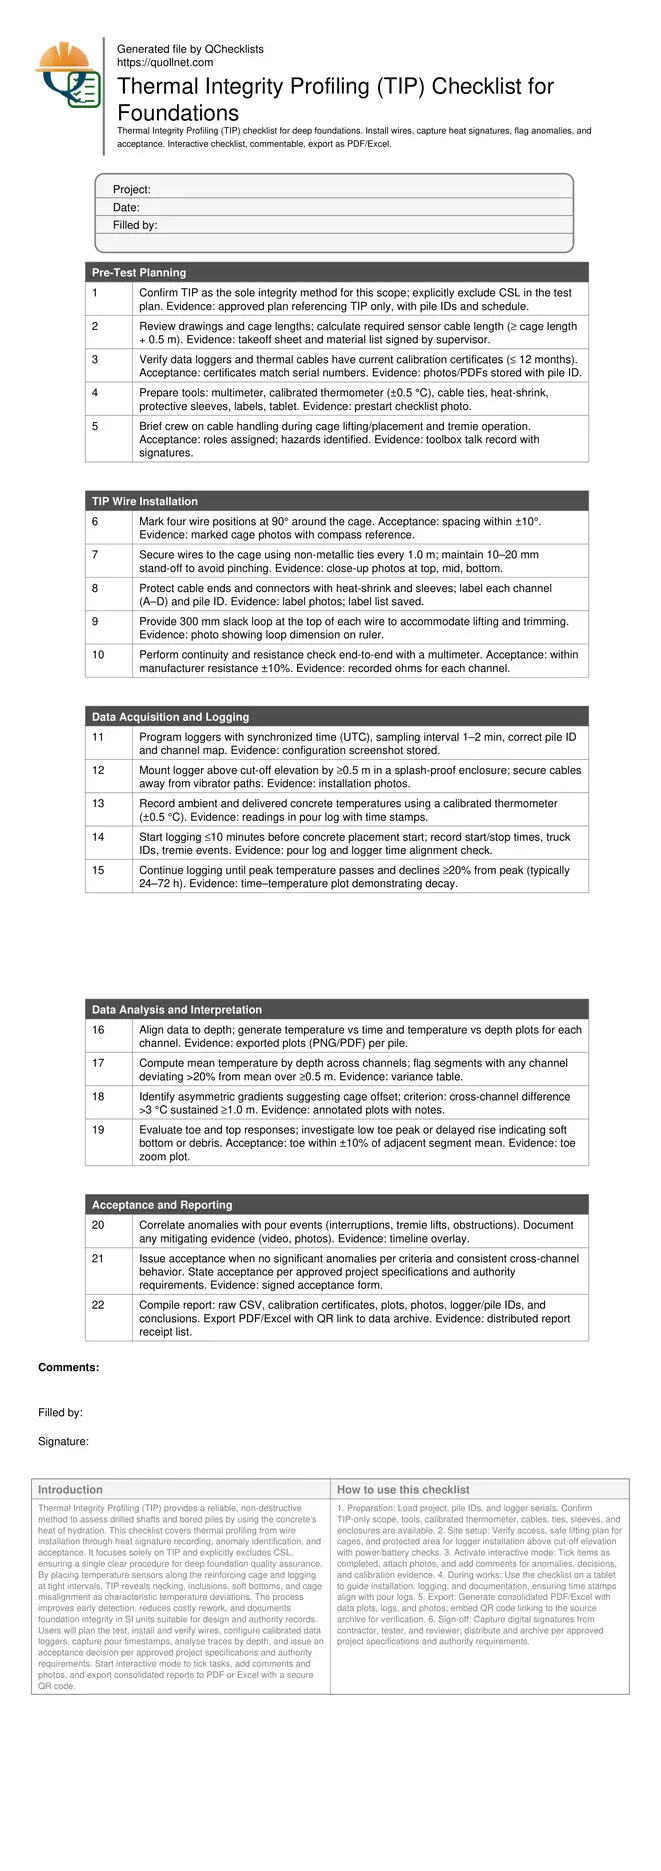
Thermal Integrity Profiling (TIP) Checklist for Foundations
Definition: Thermal Integrity Profiling (TIP) checklist for deep foundations guides builders, testers, and inspectors to install wires, record heat signatures, identify anomalies, and document acceptance, explicitly excluding CSL methods.
- Install thermal wires and log concrete heat to prove integrity.
- Detect necking, inclusions, cage offsets, and poor cover early.
- Use calibrated loggers at 1–5 minute intervals, compare traces by depth.
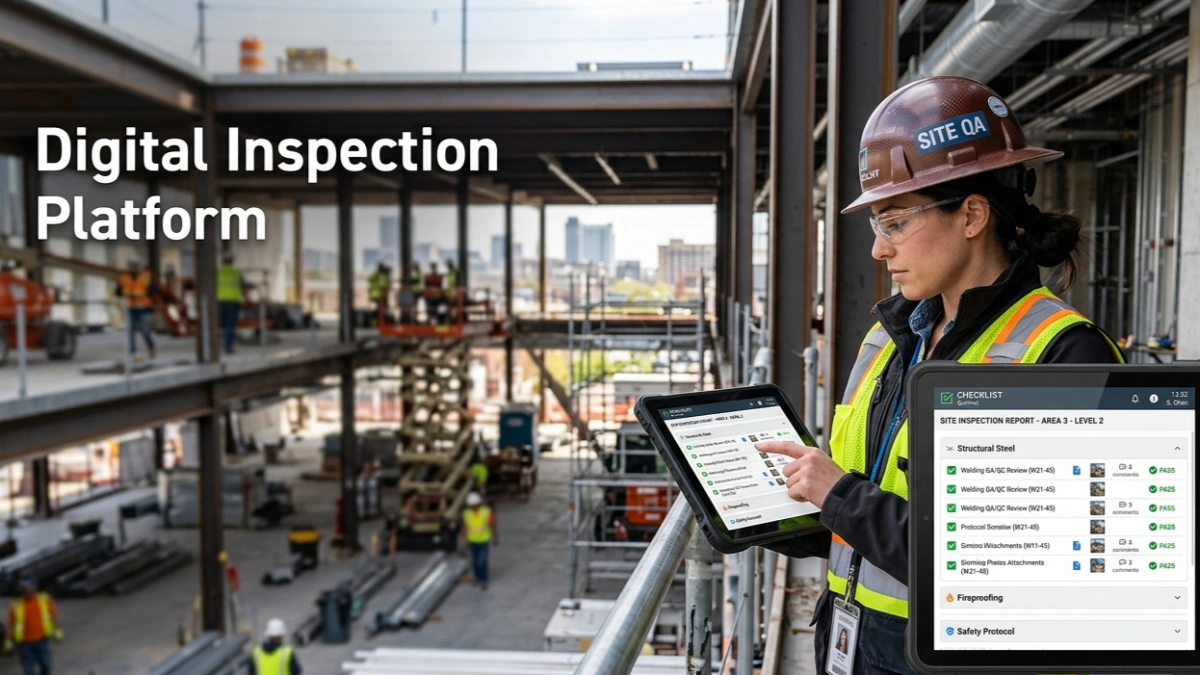
- Interactive, commentable checklist; export results with QR code.
Thermal Integrity Profiling (TIP) provides a reliable, non-destructive method to assess drilled shafts and bored piles by using the concrete’s heat of hydration. This checklist covers thermal profiling from wire installation through heat signature recording, anomaly identification, and acceptance. It focuses solely on TIP and explicitly excludes CSL, ensuring a single clear procedure for deep foundation quality assurance. By placing temperature sensors along the reinforcing cage and logging at tight intervals, TIP reveals necking, inclusions, soft bottoms, and cage misalignment as characteristic temperature deviations. The process improves early detection, reduces costly rework, and documents foundation integrity in SI units suitable for design and authority records. Users will plan the test, install and verify wires, configure calibrated data loggers, capture pour timestamps, analyse traces by depth, and issue an acceptance decision per approved project specifications and authority requirements. Start interactive mode to tick tasks, add comments and photos, and export consolidated reports to PDF or Excel with a secure QR code.
- This TIP checklist standardizes deep foundation integrity testing by guiding teams through preparation, instrumentation, logging, and evaluation. Clear tolerances, SI units, and evidence requirements help prevent data gaps, protect instrumentation during placement, and ensure traceable results that support confident foundation acceptance and reduce rework risk.
- The method captures the concrete’s heat of hydration using evenly spaced thermal wires strapped to the reinforcing cage. Consistent peak temperatures and similar curve shapes across channels indicate uniform cross-section, while sustained cold zones or asymmetric gradients by depth highlight probable necking, inclusions, or cage offset for targeted investigation.
- Interactive online checklist with tick, comment, and export features secured by QR code.
- Deliverables include time–temperature plots by depth, variance summaries, calibration records, photos, and pour logs. The package links measurements to pile IDs and logger serials, enabling rapid review by the contractor, consultant, and authority, then digital sign-off per approved project specifications and authority requirements.
Pre-Test Planning
TIP Wire Installation
Data Acquisition and Logging
Data Analysis and Interpretation
Acceptance and Reporting
Planning TIP for Drilled Shafts and Bored Piles
A successful Thermal Integrity Profiling program begins with clear scoping and instrumentation planning. Confirm that TIP is the selected method and explicitly exclude CSL to avoid mixed procedures. Check pile geometry, reinforcement details, and anticipated concrete heat development so sensor cable lengths, logger channels, and sampling intervals are correctly specified. Calibrate the thermometer (±0.5 °C) and verify logger clocks in UTC to keep pour logs aligned with time–temperature curves. During prestart, assign roles for cable handling, tremie coordination, and data custody. Environmental factors matter: cold groundwater or large diameters can delay peak temperatures and alter gradients, so plan to log for 24–72 hours. Create a data template that ties each channel to its circumferential position (e.g., 0°, 90°, 180°, 270°), enabling later identification of cage offset as asymmetric signatures. Finally, define objective criteria for anomaly flags and acceptance per approved project specifications and authority requirements.
- Exclude CSL from the scope to keep the workflow consistent.
- Match cable length to cage length plus at least 0.5 m.
- Synchronize logger time with pour logs in UTC.
- Plan logging duration for peak and decay capture.
- Map channels to cage angles for later comparison.
Installation and Logging Best Practices
Install four thermal cables at 90° spacing around the reinforcing cage, tied every 1.0 m using non-metallic fasteners. Provide 300 mm slack at the head and protect connectors with heat-shrink and sleeves. Keep cables clear of vibrators and tremie lines to prevent damage or shorting. Before lowering the cage, perform continuity and resistance checks; values within manufacturer tolerance (±10%) confirm intact circuits. Program data loggers with a 1–2 minute sampling interval and correct channel mapping, and mount the enclosure above cut-off elevation by at least 0.5 m. Start logging no later than 10 minutes before placing concrete and record ambient and delivery temperatures. Continue logging through the temperature peak and early decay (≥20% drop from peak), typically 24–72 hours, to stabilize interpretation and reduce false flags from early thermal transients.
- Use non-metallic ties every 1.0 m along the cage.
- Maintain 10–20 mm stand-off to avoid pinching.
- Start logging within 10 minutes before placement.
- Protect logger and cables from splash and vibration.
- Record ambient and concrete delivery temperatures.
Interpreting Curves and Making Acceptance Decisions
Interpretation compares each channel’s temperature by depth against the multi-channel mean. Uniform sections display similar peaks and gradients. Potential defects appear as sustained cold zones, delayed rises, or asymmetric gradients at matching depths. Flag segments where any channel deviates more than 20% from the mean over at least 0.5 m, or where cross-channel differences exceed 3 °C for 1.0 m or more. Correlate flagged depths with the pour timeline (tremie lifts, pauses, or obstructions) to distinguish construction effects from true anomalies. Evaluate the toe: unusually low peaks or flat gradients can indicate soft bottoms or debris. Acceptance is issued when the shaft exhibits consistent cross-channel behavior without significant anomalies, supported by plots, logs, and photos, and documented per approved project specifications and authority requirements.
- Compare channels against the depth-based mean.
- Flag >20% deviation sustained over 0.5 m.
- Watch for >3 °C cross-channel differences.
- Correlate anomalies with pour timeline events.
- Document acceptance with plots and evidence.
How to Use This TIP Checklist
- Preparation: Load project, pile IDs, and logger serials. Confirm TIP-only scope, tools, calibrated thermometer, cables, ties, sleeves, and enclosures are available.
- Site setup: Verify access, safe lifting plan for cages, and protected area for logger installation above cut-off elevation with power/battery checks.
- Activate interactive mode: Tick items as completed, attach photos, and add comments for anomalies, decisions, and calibration evidence.
- During works: Use the checklist on a tablet to guide installation, logging, and documentation, ensuring time stamps align with pour logs.
- Export: Generate consolidated PDF/Excel with data plots, logs, and photos; embed QR code linking to the source archive for verification.
- Sign-off: Capture digital signatures from contractor, tester, and reviewer; distribute and archive per approved project specifications and authority requirements.
Call to Action
- Start Checklist Tick off tasks, leave comments on items or the whole form, and export your completed report to PDF or Excel—with a built-in QR code for authenticity.
- Download Excel - Thermal Integrity Profiling (TIP) Checklist
- Download PDF - Thermal Integrity Profiling (TIP) Checklist
- View Image - Thermal Integrity Profiling (TIP) Checklist
Cite & Embed
“Thermal Integrity Profiling (TIP) Checklist by Quollnet”
with a link to
this source page.
FAQ
Question: How many TIP wires are required and where should they be placed?
Question: When should logging start and how long should it continue?
Question: What temperature patterns indicate anomalies during TIP analysis?
Question: How does TIP differ from CSL, and why is CSL excluded here?
Question: What if a wire fails during placement or shows no data?
Related Articles
Broader reading and guidance connected to this checklist topic.


Is It Important To Customize Your Qr Code And How To Do It?

Construction Tender Preparation Guide | Step-by-step Bidding Process
Related Checklists
Keep the workflow moving with nearby templates chosen from similar checklist content.