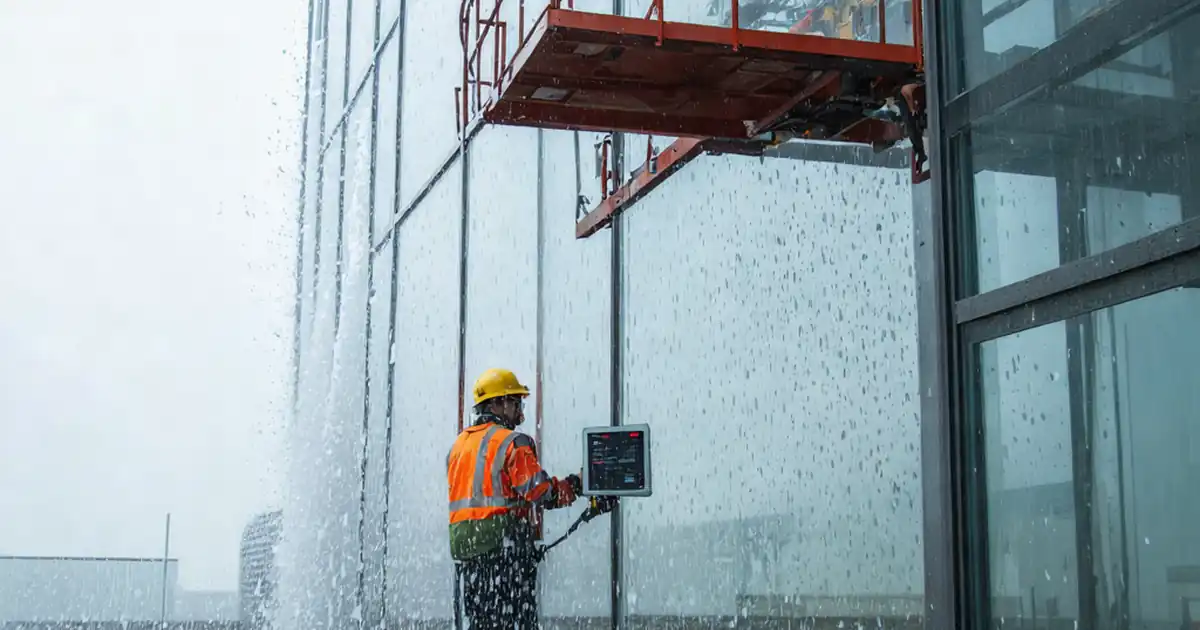
Test Façade Thermal Imaging Results for Insulation Gaps and Thermal Bridges
Definition: Test façade thermal imaging results for insulation gaps and thermal bridges using a structured, evidence-led workflow for QA engineers, energy auditors, and site managers validating building envelope thermography.
- Verify survey conditions, camera settings, and calibration before analyzing anomalies.
- Classify insulation gaps and thermal bridges with objective temperature thresholds.
- Document findings with annotated IR/visible pairs, geo-tags, and metadata exports.
- Interactive, commentable checklist with export and QR code verification.
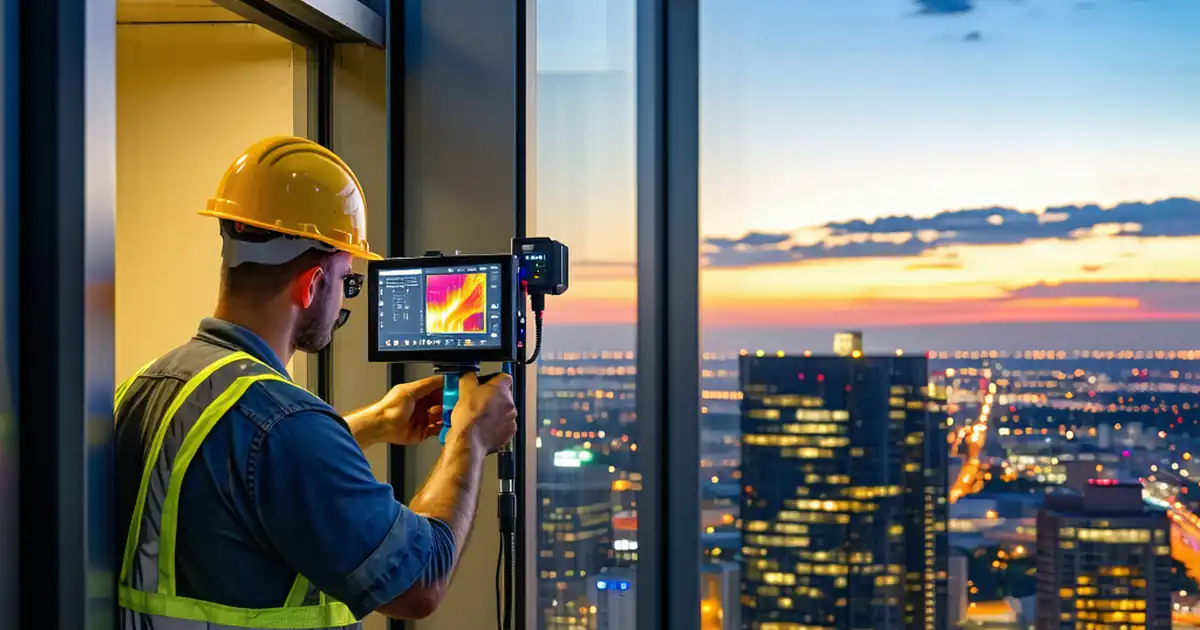
Test façade thermal imaging results for insulation gaps and thermal bridges is a focused process for validating building envelope thermography and infrared survey outputs. This checklist helps you confirm environmental conditions, camera settings, and measurement practices before classifying anomalies such as insulation voids, cold bridges, and moisture-driven cooling. By reviewing emissivity, reflected apparent temperature, focus, and angle, you avoid false positives from sun loading, metallic fixtures, or HVAC influences. The scope covers external façade result evaluation only, not roof or interior thermography, and excludes detailed retrofit design. Outcomes include defensible defect identification, prioritized remediation, and audit-ready evidence. You will capture annotated imagery, temperature deltas, site context, and approvals aligned with good practice and per approved project specifications and authority requirements. Use this interactive checklist to tick items, add comments for field clarifications, and export your findings to PDF/Excel with a QR-secured link to underlying evidence.
- Validate façade thermography by confirming weather stability, sufficient indoor–outdoor temperature differential, and correct emissivity and reflected apparent temperature inputs. This prevents misclassification from dew point effects, residual solar gains, and wind-driven cooling, ensuring that any detected insulation gaps or thermal bridges are supported by reproducible measurements and defensible documentation.
- Apply objective thresholds to distinguish area-type insulation voids and linear thermal bridges. Use isotherms, spot and line profiles, and visible-light pairs to corroborate each anomaly. Record delta temperatures, lengths or areas, moisture readings, and material context so maintenance teams can scope remedial work precisely and avoid unnecessary opening-up.
- Deliver traceable reports that combine annotated thermal images, tabulated measurements, and environmental logs. Standardize filenames, geo-tags, and elevation grids, then issue a sign-off package with digital approvals. Export as PDF/Excel for stakeholders while retaining original data for future seasonal comparisons or post-remedial verification surveys.
- Interactive online checklist with tick, comment, and export features secured by QR code.
Pre-Assessment Validation
Environmental Conditions Verification
Image Quality and Settings Review
Anomaly Identification and Classification
Reporting and Sign-Off
Control Environment and Timing for Reliable Façade Thermography
Environmental stability dictates whether façade thermal images can support confident decisions. Prioritize nighttime or uniformly overcast conditions, then maintain an indoor–outdoor temperature differential of at least 10 K for three hours before capture. Wind should remain at or below 5 m/s to avoid convective cooling that masks defects. Keep surfaces dry and at least 3 K above dew point so apparent cold spots do not simply reflect condensation. Record ambient temperature, relative humidity, and dew point concurrently with each image batch. Document HVAC and lighting states around façades to avoid artificial heat plumes near vents or service risers. When reviewing results, compare images to elevation drawings so you can standardize grid references and avoid double counting features across vantage points. Finally, corroborate any extreme anomalies with visible-light photos; reflections, wet patches, or recently sunlit areas can otherwise mimic missing insulation or continuous thermal bridges.
- Capture under ΔT ≥ 10 K, wind ≤ 5 m/s, dry surfaces.
- Maintain surface–dew point margin ≥ 3 K to avoid condensation artifacts.
- Use elevation grids to align images and prevent double counting.
- Record HVAC and lighting status to identify heat plume influences.
Get Measurement Settings Right: Emissivity, Tref, Focus, and Angle
Accurate emissivity and reflected apparent temperature inputs are essential for quantitative comparisons. For painted render, an emissivity around 0.90 (±0.05) is typical; metals require lower values and careful reflection control. Use the crumpled-foil method to estimate Tref, and document both values in screenshots. Ensure crisp focus and sufficient pixel coverage; the smallest target should span three or more pixels to keep spot measurements valid. Maintain a near-perpendicular view (±10°) and verify distance with a laser measure to minimize parallax and specular reflections. Avoid histogram clipping by setting level and span so cold and hot tails remain visible. Store radiometric files, not just images, to allow re-leveling during review. When images lack these qualities, reject them early and request re-survey rather than risking misleading interpretations or costly, unnecessary opening-up.
- Set material-specific emissivity and measure reflected temperature.
- Verify focus and pixel coverage; avoid motion blur.
- Keep view angle near perpendicular to reduce reflections.
- Prevent histogram clipping; save radiometric data for re-leveling.
Classify Anomalies and Rule Out Confounders Before Recommending Fixes
Classify area-type anomalies as probable insulation gaps when their temperature differs by 3 K or more from adjacent insulated regions under a confirmed ΔT ≥ 10 K. For linear thermal bridges at slab edges, columns, or fixings, use line profiles and accept sustained contrasts of at least 2 K over 1.0 m. Distinguish moisture-related cooling by taking moisture meter readings and daylight photos; wet substrates often appear anomalously cool without indicating missing insulation. Exclude heat sources like vents and luminaires by cross-referencing daylight images and as-built drawings. Rate severity (1–2 K low, 2–4 K medium, >4 K high) to prioritize remedial actions, then propose practical fixes such as adding thermal breaks, sealing air leakage paths, or topping up insulation. Summarize evidence with annotated IR/visible pairs, measurement tables, and logged conditions so stakeholders can act decisively.
- Area anomalies: ΔT ≥ 3 K versus adjacent insulated area.
- Linear bridges: ΔT ≥ 2 K sustained over ≥ 1.0 m.
- Moisture checks and daylight photos to avoid false positives.
- Severity bands guide remediation priority and cost planning.
How to Use This Checklist
- Preparation: Gather radiometric images, visible-light pairs, survey logs, weather data, and calibration records. Have IR analysis software, hygrometer, moisture meter, laser distance meter, and a calculator for dew point checks.
- Preparation: Confirm project drawings and elevation grids are available. Clarify which façades were imaged and the intended acceptance thresholds per approved project specifications and authority requirements.
- Using the Interactive Checklist: Start interactive mode, tick each item as you verify evidence, and attach photos, logs, and screenshots directly to their corresponding steps.
- Using the Interactive Checklist: Add time-stamped comments to discuss anomalies with teammates. Generate interim exports to PDF/Excel to share progress for rapid review.
- Sign-Off: When complete, create a consolidated report with annotated images, measurements, and condition logs. Enable the embedded QR code to link back to the full evidence set.
- Sign-Off: Obtain digital signatures from the QA lead and client representative, distribute the report to stakeholders, and archive all data with version control for traceability.
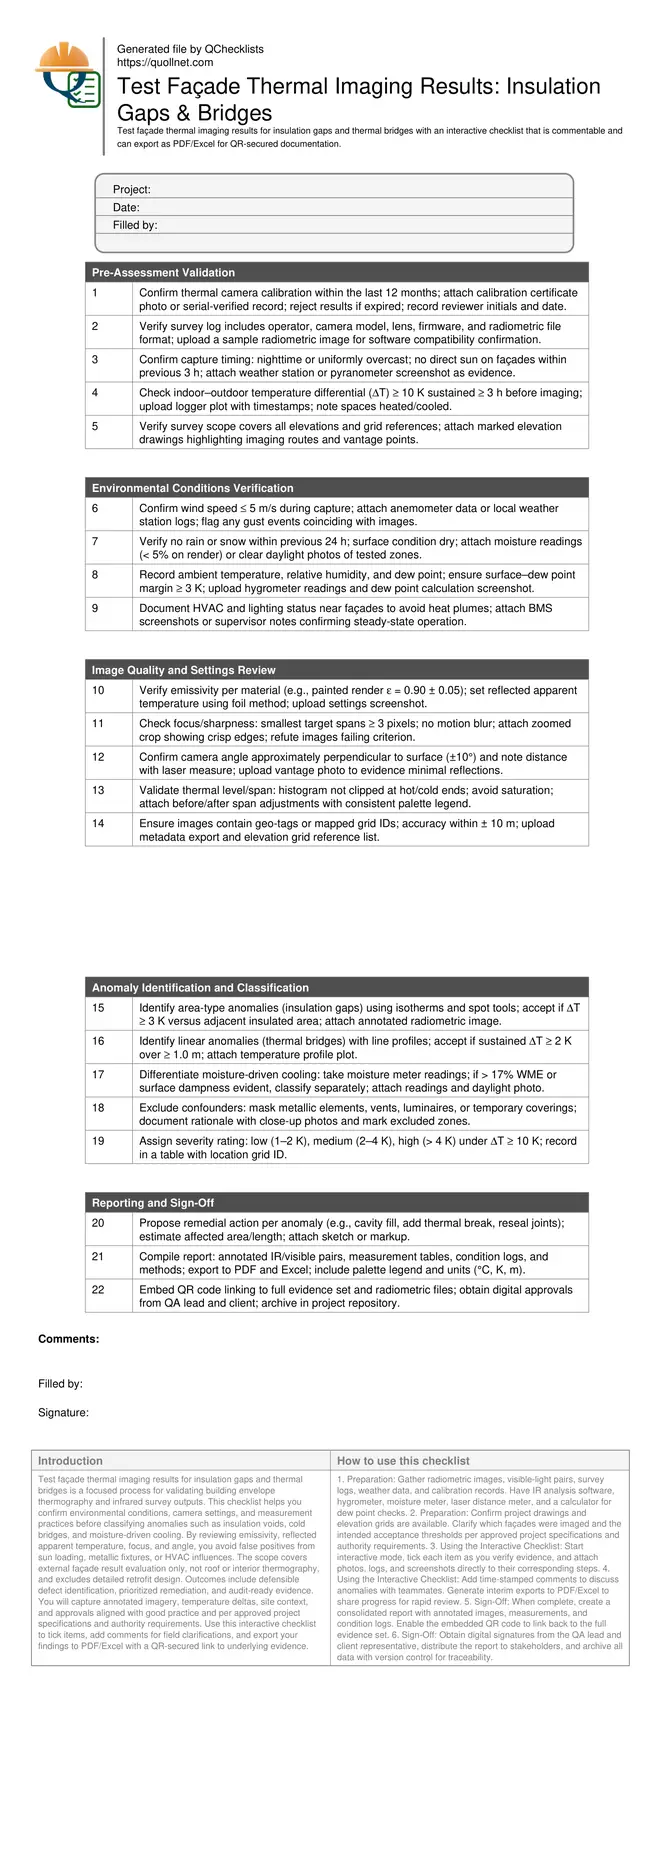
Call to Action
- Start Checklist Tick off tasks, leave comments on items or the whole form, and export your completed report to PDF or Excel—with a built-in QR code for authenticity.
- Download Excel - Façade Thermal Imaging Result Testing
- Download PDF - Façade Thermal Imaging Result Testing
- View Image - Façade Thermal Imaging Result Testing
Cite & Embed
“Façade Thermal Imaging Result Testing by Quollnet”
with a link to
this source page.

FAQ
Question: What temperature differential (ΔT) do I need for dependable façade thermography?
Question: How do I avoid false positives from sun exposure or reflections?
Question: Which emissivity should I use for common façade materials?
Question: When should I request a re-survey instead of accepting the results?
Related Articles
Broader reading and guidance connected to this checklist topic.
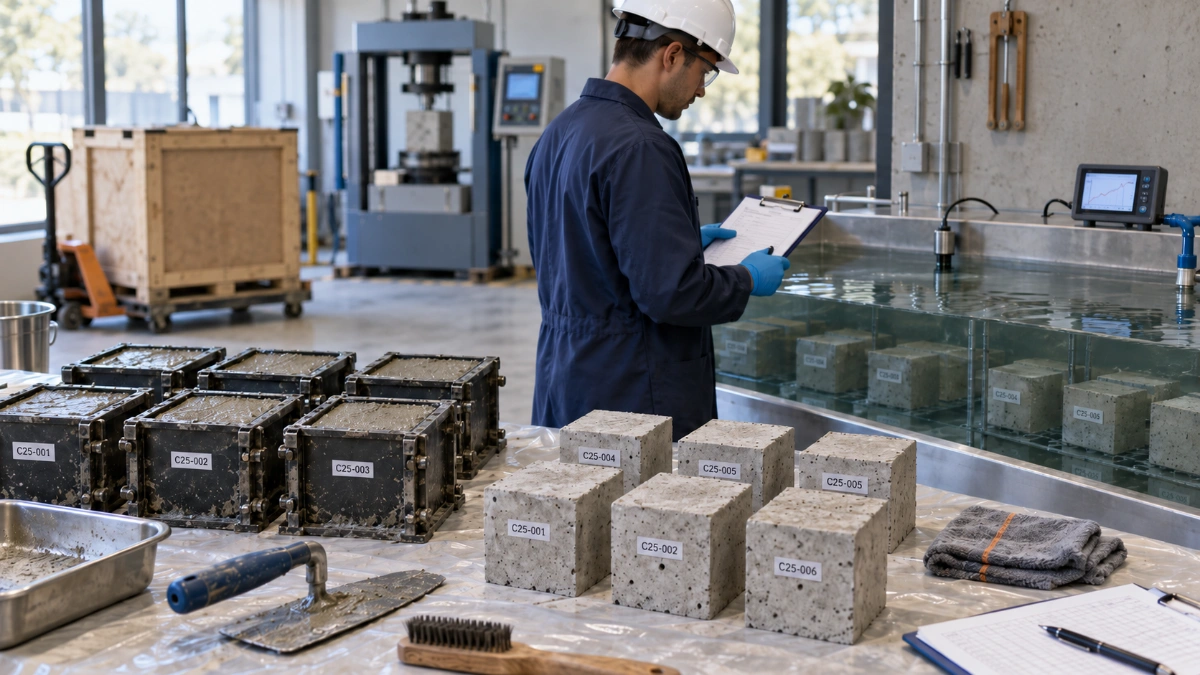
Concrete Cube Curing: Site Storage, Water Tank & Laboratory Requirements

Master Construction Project Cashflow With Cashflowpot
Daily Construction Delay Report | Free Pdf, Excel Sample Download
Download Excel Format Snag List
Related Checklists
Keep the workflow moving with nearby templates chosen from similar checklist content.