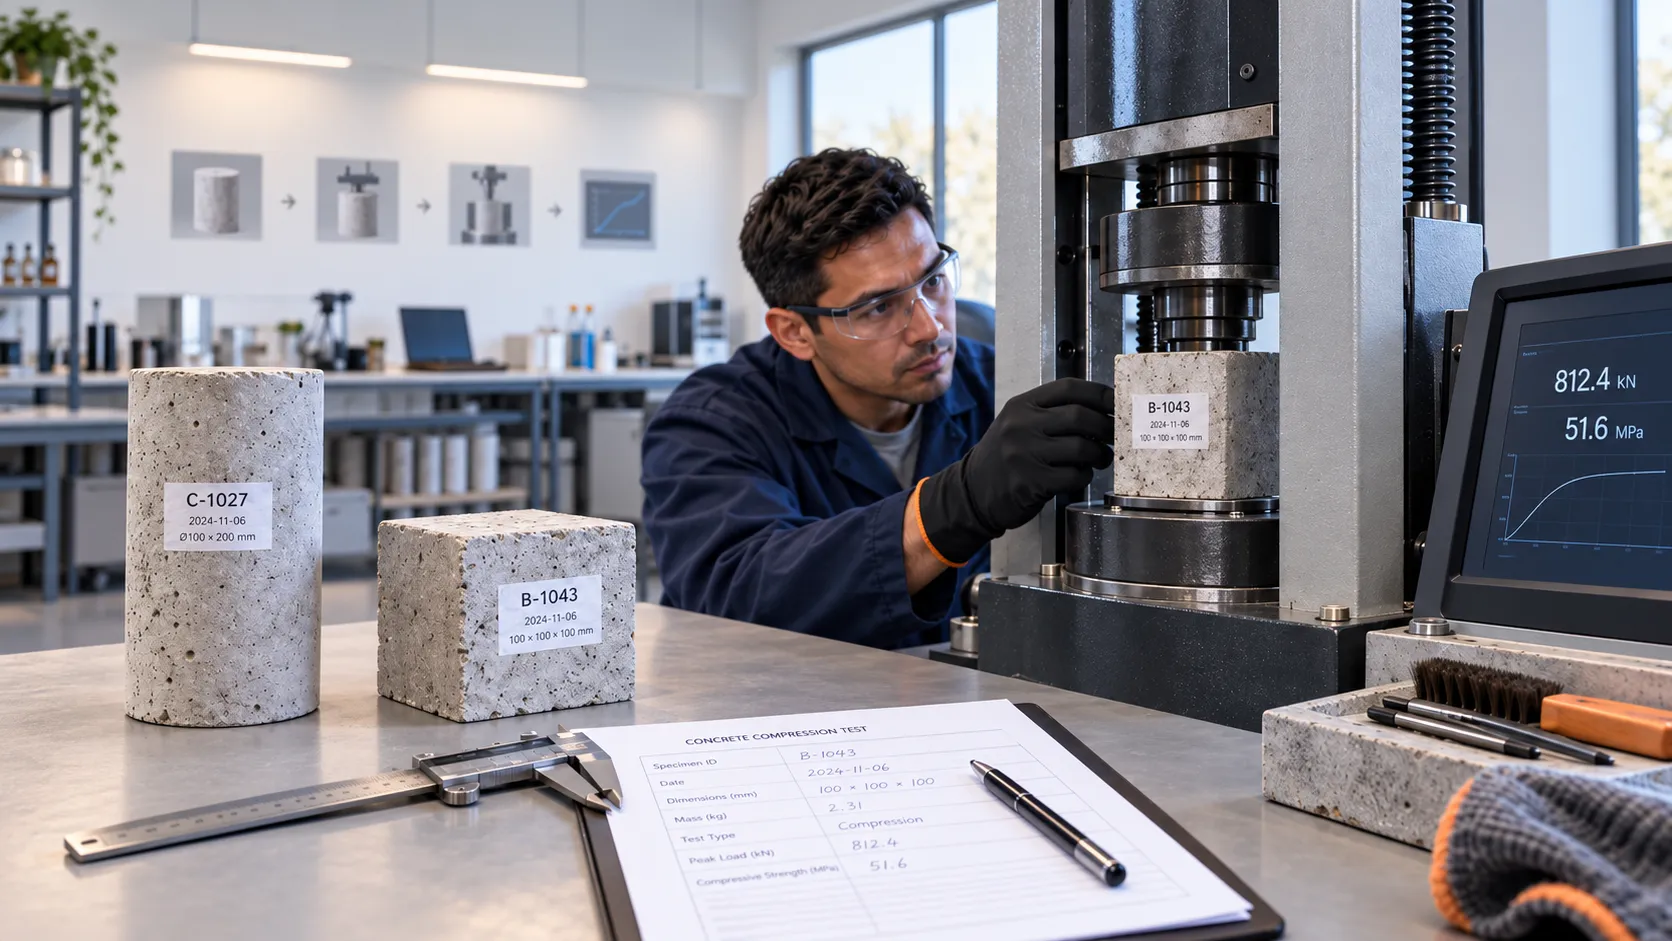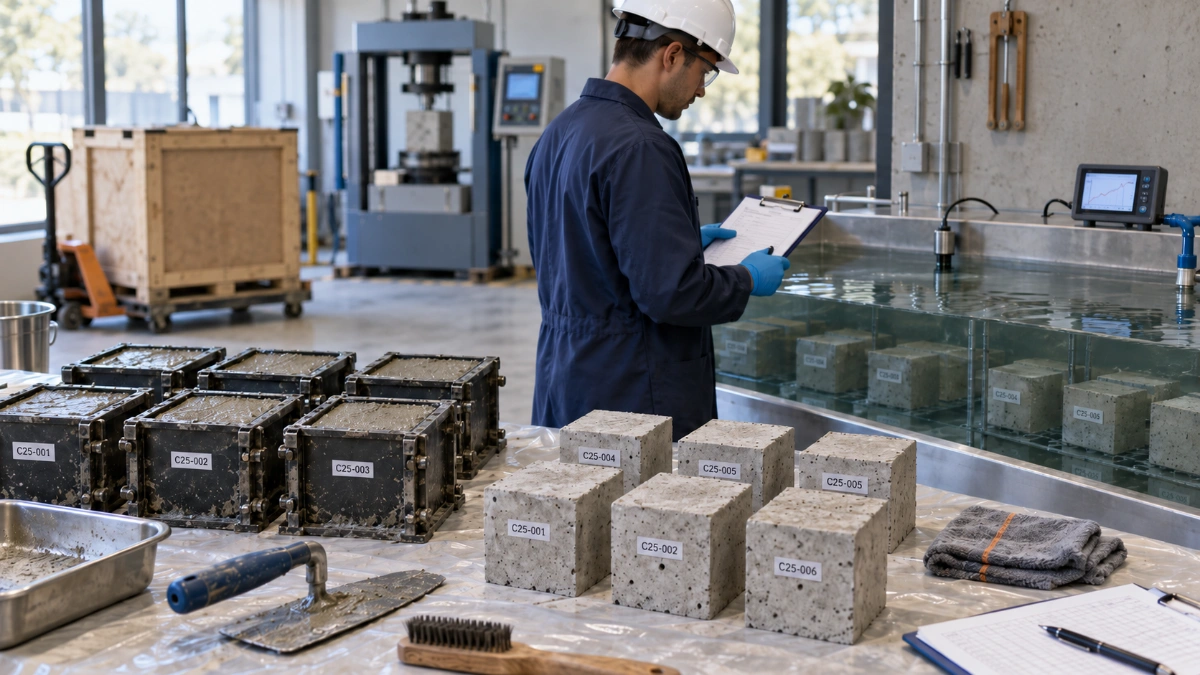
How Improper Curing Can Affect Concrete Cube and Cylinder Test Strength
Improper concrete specimen curing can materially reduce a reported cube or cylinder compressive-strength result, but there is no universal percentage correction for a curing deviation. The defensible approach is to reconstruct the specimen's curing history, compare it with the applicable standard, use relevant experimental data to estimate the possible strength impact, and clearly separate measured data, interpolation and extrapolation.
Important: a curing-impact estimate is an investigation aid. It does not change the laboratory result, prove the cause of a low result, or determine contractual acceptance of the concrete in the structure.
Why specimen curing matters when a 28-day result is low
A standard-cured concrete specimen is intended to provide a controlled basis for evaluating the sampled concrete. If the specimen is exposed to excessive heat, moisture loss, freezing, prolonged uncontrolled storage, delayed transfer to controlled curing, poor transport conditions or unsuitable laboratory curing, the measured strength can partly reflect the specimen's own history.
This is why a low cube or cylinder result should not automatically be treated as proof that the concrete placed in the structure developed the same low strength. The investigation should consider both the concrete and the test process.
Possible contributors include:
- nonstandard specimen curing;
- sampling or moulding errors;
- inadequate consolidation;
- specimen damage or incorrect dimensions;
- improper end preparation or positioning;
- compression-machine or loading problems;
- identification or traceability errors; and
- normal material and test variability.
Curing is therefore one branch of the investigation, not an automatic correction to the reported strength.
Standard curing requirements and strength-impact estimates are two different questions
The first question is whether the specimen was made, protected, transported and cured in accordance with the standard adopted by the project. The second question is how much a documented deviation may have influenced the measured compressive strength. Standards answer the first question; experimental evidence is needed for the second.
ASTM C31/C31M
ASTM C31/C31M covers making and curing field concrete test specimens and provides standardized requirements for initial curing, transport and subsequent curing. Standard-cured specimens are used for purposes such as specified-strength acceptance and quality control. The exact curing limits and procedures should be taken from the edition adopted by the project.
ASTM C31/C31M does not provide a general equation such as “each degree above the curing limit causes a fixed percentage strength loss.”
BS EN 12390-2
BS EN 12390-2:2019 covers making and curing specimens for strength tests. Under the reference procedure, specimens are protected against shock, vibration and dehydration before demoulding and are then placed into controlled reference curing. The applicable project specification and adopted national implementation should be checked for the exact procedure.
Again, the standard establishes a reference curing method; it does not assign a universal percentage penalty to every curing deviation.
What research shows about improper initial curing
A useful experimental dataset was developed by Jackson White at Auburn University in 2023. Concrete cylinders were initially cured at six temperatures — approximately 15.6°C, 20.0°C, 25.6°C, 28.9°C, 32.2°C and 37.8°C — for 24, 48 or 72 hours. They were then transferred to controlled moist curing until testing at 28 days.
The programme included eight concretes using different cementitious systems. Using 20°C as the reference initial-curing temperature, the study reported relative 28-day strength differences and observed a maximum reduction of 23% among the investigated conditions. The study's ±10% evaluation criterion was an analytical threshold used in that research; it should not be converted into a universal project acceptance tolerance.
Kyle Fleming's related Auburn University field study evaluated jobsite cylinder-curing practices and reported a maximum measured 28-day strength reduction of 22% under the nonstandard conditions observed in that programme.
Do not turn 22% or 23% into a generic curing allowance. Those values belong to specific research programmes, concrete mixtures and exposure conditions. The useful engineering information is the relationship within the source data, not a universal penalty.
Temperature cannot always be separated from moisture loss
Temperature is only part of the curing environment. A hot specimen that remains well protected against moisture loss is not the same condition as a hot specimen exposed to dry air.
Published nonstandard-curing data cited in the research literature include combined air-temperature and relative-humidity exposures. Those results show why it is misleading to create independent generic coefficients such as “X% loss per degree Celsius” plus “Y% loss per 10% relative humidity.” Temperature, humidity, duration, specimen protection and the concrete mixture interact.
Where moisture protection is unknown, confidence in a temperature-only estimate should be reduced.
How to calculate the relative strength difference
The most transparent starting point is the relative difference between specimens exposed to the investigated curing condition and reference-cured specimens from the same experimental programme:
\[R=\frac{f_{c,\mathrm{condition}}-f_{c,\mathrm{reference}}}{f_{c,\mathrm{reference}}}\times100\]
where R is the relative strength difference in percent. A negative value means the investigated condition produced lower strength than the reference condition.
Simple example
If reference-cured specimens achieve 40 MPa and companion specimens subjected to an investigated curing condition achieve 34 MPa:
\[R=\frac{34-40}{40}\times100=-15\%\]
The experimental condition produced a result approximately 15% below the reference specimens. That does not mean every specimen exposed to nominally similar conditions will lose exactly 15%.
Interpolation can estimate conditions between tested points
Research programmes test selected temperatures and durations, not every possible combination. When the actual curing condition lies between tested points, interpolation can provide a transparent estimate without pretending that a new experimental measurement exists.
Interpolation between curing durations
For a duration between two tested durations:
\[R_d=R_1+\frac{d-d_1}{d_2-d_1}(R_2-R_1)\]
For example, if a source dataset gives −9% at 24 hours and −6% at 48 hours, a 36-hour interpolation gives:
\[R_{36}=-9+\frac{12}{24}(3)=-7.5\%\]
The calculation follows the measured trend between those source points. It should not be replaced by an assumed “loss per day” rule.
Interpolation between curing temperatures
The same method can be used when the investigated temperature lies between two experimental temperatures:
\[R(T)=R(T_1)+\frac{T-T_1}{T_2-T_1}\left[R(T_2)-R(T_1)\right]\]
Worked example: 35°C for 48 hours
Consider a Type I Portland-cement cylinder that was protected against moisture loss, initially cured at an average of 35°C for 48 hours, and then transferred to controlled moist curing.
Using approximate 48-hour values from the White dataset:
- at 32.2°C: relative difference ≈ −11%;
- at 37.8°C: relative difference ≈ −16%.
Because 35°C is approximately halfway between those temperatures:
\[R_{35}\approx-11+0.50(-5)=-13.5\%\]
The estimated 28-day impact for that scenario is therefore approximately −13.5%. It is an interpolation between published experimental points, not a universal curing penalty.
When both temperature and duration fall between tested points
When both variables are inside the experimental grid, the calculation can be performed in two stages: first interpolate for duration at each surrounding temperature, then interpolate between those two temperature-adjusted values. This is effectively piecewise bilinear interpolation.
The important condition is that both inputs remain inside the tested empirical envelope. Once either input moves beyond the source data, the calculation becomes extrapolation.
Interpolation and extrapolation should never be reported as equivalent
Interpolation estimates a value between experimental observations. Extrapolation extends a trend beyond the conditions that were actually tested.
For the White temperature-duration grid, a scenario such as 35°C and 48 hours is inside the tested range. A scenario such as 42°C, 96 hours or another condition outside the tested envelope is not.
A numerical proxy can still be useful during an investigation, but it should be labelled clearly:
Extrapolated — outside validated empirical range. Treat the result as low-confidence scenario information, not as an experimentally validated strength-loss value.
Why conservative extrapolation is preferable to blindly extending a slope
A mathematical line can produce physically misleading results when it is extended too far. If the final two measured points happen to show less adverse effect at the longer duration, extending that trend indefinitely could eventually predict that worsening curing conditions restore all of the lost strength or even improve strength beyond the reference result.
There is no experimental basis for such a conclusion. A conservative model should therefore avoid extending an apparent recovery indefinitely outside the measured range. Holding the result at the empirical boundary can be more defensible than allowing an unsupported mathematical reversal.
That safeguard does not validate the extrapolated result. It simply prevents the model from creating an obviously misleading trend.
Use minimum, maximum and average curing temperatures together
A single average temperature can conceal important excursions. For example, an initial-curing period with an average of 28°C, a minimum of 18°C and a maximum of 38°C is not well represented by the average alone.
For an investigation, record the average temperature where available, but also retain the documented minimum and maximum. A large spread should reduce confidence in a single-temperature representation even if a central estimate is still calculated.
Cement type and supplementary cementitious materials can change the response
The White programme included Type I and Type III Portland cement and mixtures containing fly ash, slag cement and silica fume. Their responses were not identical.
A curing-impact model should therefore use a verified curve for the selected cementitious system where suitable data exist. Where they do not, another curve may be used only as a clearly identified engineering proxy with reduced confidence.
Can cylinder curing data be applied to concrete cubes?
With caution. Much of the experimental evidence used in this type of curing-impact assessment was developed using moulded cylinders. The physical mechanisms — hydration, temperature and moisture loss — also affect cubes, but the numerical source data remain cylinder data.
Applying a cylinder-derived curve to a cube is therefore an indirect use of the evidence and should carry lower confidence. A cube-to-cylinder strength conversion factor should not be introduced to solve this issue; specimen geometry conversion and curing-response applicability are different questions.
For the actual compression-test procedure and strength calculation, see how to perform a concrete compressive strength test on cubes and cylinders.
What if later laboratory curing was also improper?
Many initial-curing experiments returned the specimens to controlled moist curing after the initial exposure. Their reported percentage therefore represents the effect of the investigated initial-curing period under that experimental programme.
If a field specimen was initially too hot and then spent several weeks in uncontrolled dry conditions, a model derived from specimens that returned to proper moist curing after 48 or 72 hours cannot quantify the entire history.
The initial-curing estimate may still be informative, but it should be described as an estimate of one component of the curing deviation, not the total effect.
Can improper curing plausibly explain a failed 28-day result?
The useful comparison is between the observed strength shortfall and the estimated curing-impact scenario.
If the project reference strength is 40 MPa and the measured specimen result is 34 MPa, the observed shortfall is:
\[S=\frac{40-34}{40}\times100=15\%\]
If a documented curing history produces an empirical estimate of approximately −13.5%, the two values are of a similar order of magnitude. Poor specimen curing is therefore a plausible contributor worth investigating.
It still does not prove that curing caused the low result. Sampling, moulding, consolidation, testing and material variability may also have contributed, and the concrete in the structure did not experience the same specimen geometry and curing history.
Do not “correct” a failed test result for curing
A mathematical reference-curing equivalent can be useful as a scenario, but it should not replace the laboratory result.
If an estimated fractional loss is L, an indicative reference-curing equivalent can be written as:
\[f_{\mathrm{equiv}}=\frac{f_m}{1-L}\]
For a measured result of 34 MPa and an estimated curing effect of 13.5%:
\[f_{\mathrm{equiv}}=\frac{34}{1-0.135}\approx39.3\ \mathrm{MPa}\]
The recorded test result remains 34 MPa. The calculated 39.3 MPa is only a scenario showing what strength would correspond mathematically if the assumed relative curing reduction fully accounted for the difference.
This calculation can help answer: Is the documented curing deviation large enough to plausibly explain much of the observed shortfall? It should not be used as a substitute acceptance result.
Concrete Specimen Curing Impact Estimator
The calculator below is intended to support the investigation workflow described in this article. It distinguishes standard-reference checks from empirical strength-impact estimates and identifies whether the numerical result is based on a source point, interpolation or extrapolation.
Concrete Specimen Curing Impact Estimator
Estimate the potential effect of a documented specimen-curing deviation on a 28-day compressive-strength result.
Estimated 28-Day Strength Impact vs Initial Curing Deviation
Advanced curing documentation
ASTM C511 specifies calcium-hydroxide-saturated storage water to prevent leaching. This check does not add a percentage penalty.
Compare with the failed result
Observed shortfall: Enter both strengths.
Model assumptions & sources
Standards comparison and empirical estimation are independent. The 28-day model uses local published data only; no standard supplies the percentage-loss equation.
- ASTM C31/C31M-26b — field specimen making, initial curing, transport and standard/field-cured purposes.
- ASTM C511-21 — moist-room and water-storage equipment and conditions.
- BS EN 12390-2:2019 — making, initial protection, demoulding, final curing and transport.
- White (2023), Auburn University — Type I cylinder data transcribed from Table 4-2 and interpolated only inside its temperature/duration grid.
- Obla et al. (2018), Concrete International — coupled air-exposure regimes; values reproduced in Fleming (2023), Table 2-2.
Supported numerical domain: 28-day molded specimens, 24–72 hours of initial exposure, 100% Type I Portland cement concrete, and compliant final moist curing. The protected-temperature grid covers 15.6–37.8 °C. A documented temperature span—or a known difference between the average and a one-sided extreme—above 4 °C, inconsistent average/extreme records, or an excursion outside the applicable source-temperature range receives no percentage estimate; missing extremes lower confidence. The 4 °C and ±2 °C air-regime limits are applicability guards, not strength coefficients. Cube results lower applicability confidence. Type III, SCM/unknown binders, moist-covered or other moisture histories, continued nonstandard final curing, and source-regime temperature mismatches receive no percentage estimate. Interpolation reproduces source points exactly; predictive uncertainty between points and experimental variability are not quantified.
Engineering estimate based on selected standards and published experimental data. Preserve the original laboratory result. Project acceptance, retesting and structural investigation remain subject to the governing specification and engineer's review.
Use the result together with the specimen records, the adopted test standard, the concrete mixture information and the wider low-strength investigation. Do not use the calculator as an automatic contractual correction factor.
What to check after an unexpectedly low concrete strength result
Reconstruct the specimen history as far as practical. The quality of the estimate cannot exceed the quality of the records.
- Confirm specimen identification, test age and reported dimensions.
- Trace the specimen to the concrete batch, truck and delivery ticket.
- Check sampling, moulding and consolidation records.
- Record the concrete temperature at sampling where available.
- Identify the initial curing location and moisture-protection method.
- Collect minimum, maximum and average curing temperatures.
- Confirm the time in initial curing and the actual demoulding time.
- Check transport timing and transport conditions.
- Confirm laboratory receipt time and subsequent tank or chamber curing.
- Review companion specimens and results from the same pour or mixture.
- Check specimen preparation, machine records and loading observations.
- Review any NCR, laboratory note, site diary entry or curing-box alarm associated with the specimens.
For projects that use a consolidated test log, a concrete cube test register can help preserve the traceability needed for this type of investigation.
How to report a curing-impact assessment
A short engineering note should make the evidence status visible. A useful structure is:
| Item | What to state |
|---|---|
| Observed result | Recorded test strength and test age. |
| Reference requirement | Applicable specification or evaluation basis. |
| Documented curing history | Temperature, duration, moisture protection, transport and final curing. |
| Source evidence | Research dataset and how closely it represents the specimen. |
| Calculation status | Measured source point, interpolation or extrapolation. |
| Conclusion | Whether curing is a plausible contributor, with limitations and recommended next steps. |
Limitations of curing-impact estimates
Published datasets represent particular concrete mixtures, specimen geometries, temperatures, durations and curing procedures. Actual field results can also be affected by cement and supplementary cementitious material characteristics, water-binder ratio, admixtures, fresh-concrete temperature, air content, consolidation, moulds, handling, transport, end preparation, machine condition and normal variability.
A curing-impact estimate also does not determine the actual strength of concrete already placed in the structure. Where a low result has contractual or structural significance, the project procedure may require review of companion results, additional testing, in-place assessment, cores, structural evaluation or other measures directed by the responsible engineer and governing documents.
The key engineering principle
Improper specimen curing can materially affect concrete cube and cylinder compressive-strength results, but a fixed loss-per-degree or loss-per-day rule is not defensible.
A better investigation process is to reconstruct the actual specimen history, check it separately against the applicable curing standard, identify empirical data that reasonably represent the exposure, calculate relative differences from that source data, interpolate only within the tested range, label extrapolation clearly, reduce confidence where the specimen or concrete differs from the evidence, and use the result as one part of the engineering investigation rather than as an automatic corrected strength.
References
ASTM C31/C31M-26 — Standard Practice for Making and Curing Concrete Test Specimens in the Field
BS EN 12390-2:2019 — Testing hardened concrete: Making and curing specimens for strength tests