Construction Organization Chart (Project Org Chart)
Summary:
A construction organization chart shows who is responsible for what, who reports to whom, and how decisions escalate on a project. In tenders, clients often require two charts: a Company Organization Chart (head-office support + governance) and a Project Organization Chart (site delivery team). On many projects, the submitted org chart (plus CVs/interviews for key staff) becomes a contractual commitment—so missing boxes, unclear reporting, or unqualified personnel can create compliance risk.
Downloads (templates):
- Org Chart Excel Template (editable): Excel organization chart template site
- Org Chart PDF Template (printable): PDF organization chart template site
- Org Chart PowerPoint Template (presentation): PowerPoint organization chart template site
- RACI / Responsibility Matrix (bonus): Excel RACI matrix construction template
- Matrix Org Chart Excel Template (editable): Excel organization chart template matrix
- Matrix Org Chart PDF Template (printable): PDF organization chart template matrix
- Corporate Construction Org Chart Excel Template: Excel organization chart template corporate
What is a Construction Organization Chart?
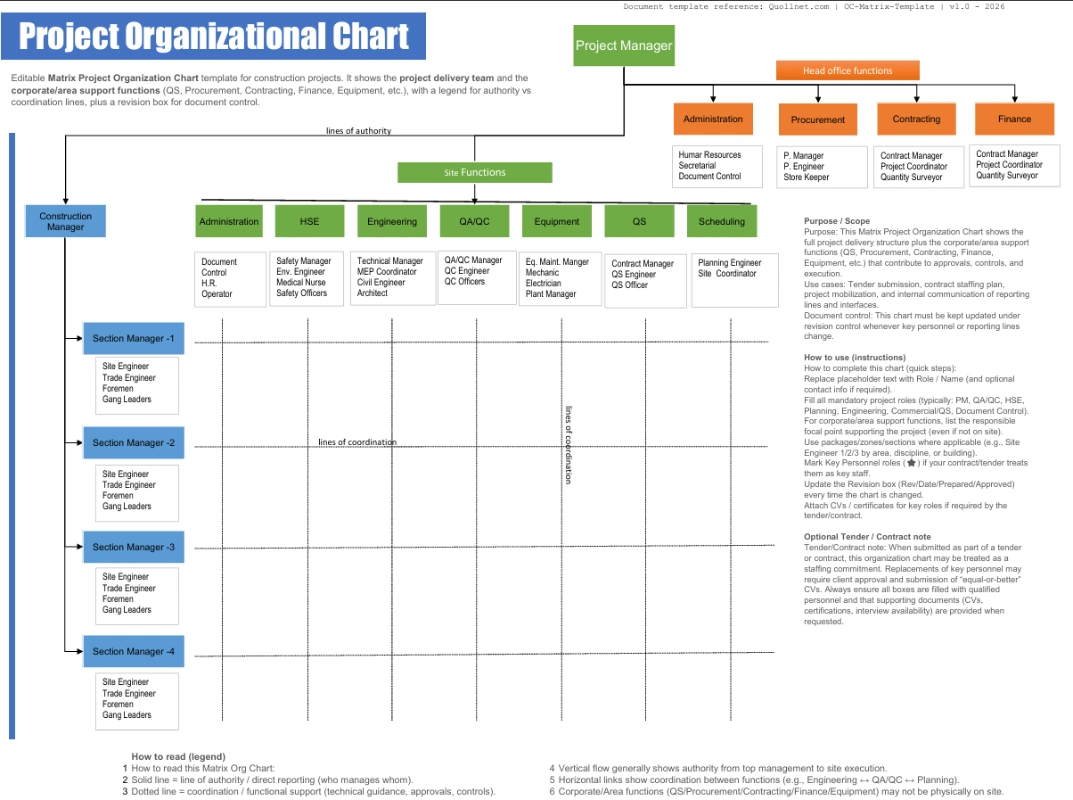
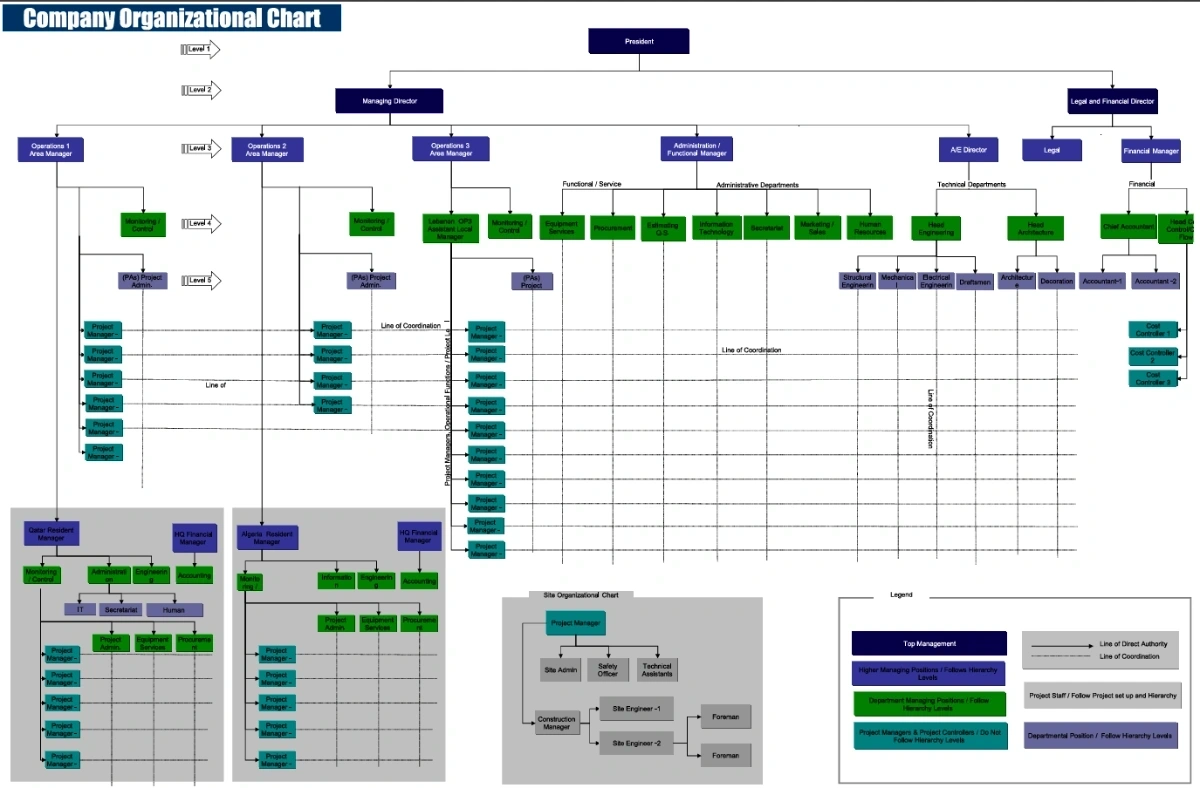
Project Organization Chart Image - Matrix Format -
A construction organization chart (org chart) is a visual “map” of the project team that clarifies:
-
Reporting lines (who reports to whom)
-
Authority (who approves, directs, and escalates)
-
Interfaces (client/engineer/PMC ↔ main contractor ↔ subcontractors)
Company org chart vs Project org chart
-
Company Organization Chart: Your permanent structure (directors, departments, functional leads: engineering, procurement, QS, HSE, QA/QC, HR, finance). Clients ask for it to confirm you have the back-office capacity to support the job.
-
Project Organization Chart (Project Org Chart): The project-specific delivery team (PM, site management, discipline engineers, planners, QA/QC, HSE, commercial, document control, etc.). Clients ask for it to confirm you can deliver on site.
Many contractors use a matrix organization chart to show both (project delivery + head-office support) in one view—but it must still be clear who has day-to-day authority on the project.
Types of Organization Charts Used in Construction
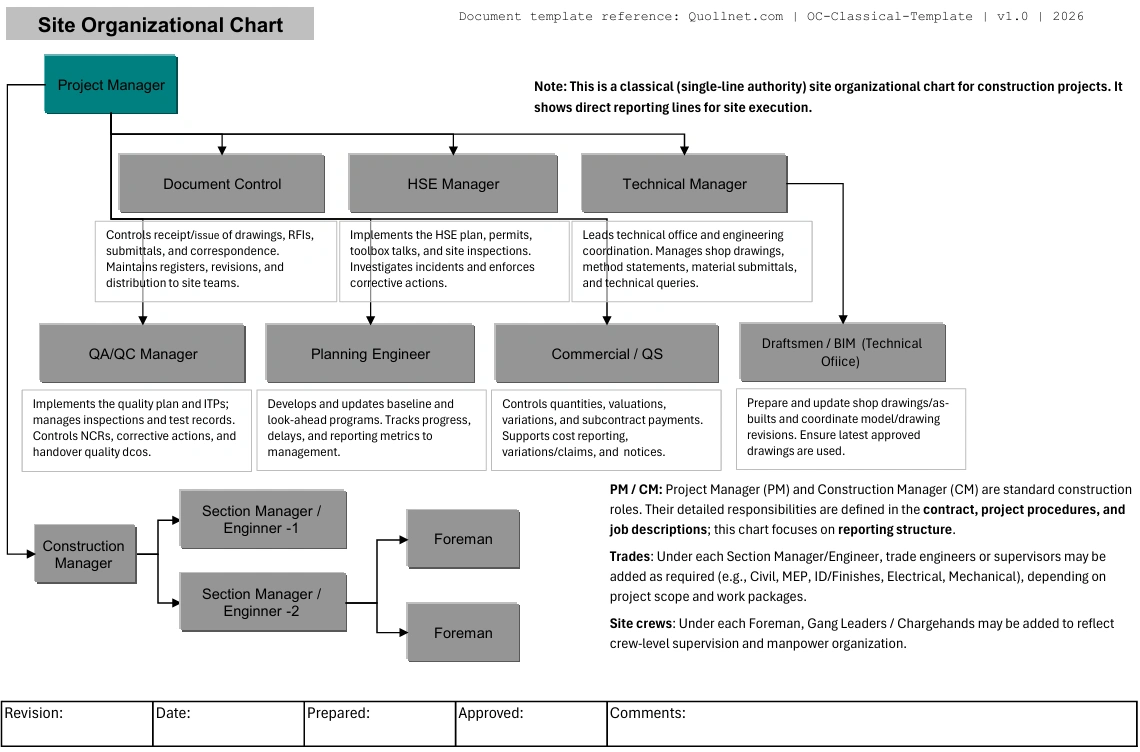
Project Organization Chart - Classical Tree -
Below are the most common chart types you’ll see in construction tenders and project execution.
Functional organization chart
Organized by departments (Engineering, Procurement, Construction, QA/QC, HSE, Commercial).
Use it when the client wants to see company capacity and internal controls.
Project organization chart
Organized around the project team (PM → site team → discipline teams).
Use it as the primary chart for site execution and daily reporting.
Matrix organization chart
Shows dual reporting (e.g., a Project QA/QC Manager reports to the Project Manager and has a dotted line to the Corporate QA/QC Director).
Use it when head office actively supports or governs the project, but make sure it doesn’t confuse decision-making.
Contract / delivery organization chart
Shows contractual relationships (Client → Engineer/PMC → Main Contractor → Subcontractors/Suppliers).
Use it to clarify who is contracted to whom, especially on EPC/DBB/PMC-heavy setups.
Site organization chart
A simplified, site-only chain of command (Site Manager → Section Engineers → General Foremen → Foremen → Gangs).
Use it for site control, safety briefings, and operational clarity.
Tender Requirements
On many tenders, the org chart is not “nice to have”—it’s part of the technical submission and sometimes a scored item.
What clients commonly request:
-
Company Organization Chart (often used to assess capability and governance)
-
Project Organization Chart for the specific project
-
List of key personnel with CVs, certificates/licenses where applicable, and availability/commitment statements
-
Sometimes: interviews (especially for PM, Construction Manager, QA/QC Manager, HSE Manager, Planner, Commercial/QS lead)
What the client is usually checking:
-
All critical functions are covered (QA/QC, HSE, Planning, Commercial, Engineering, Document Control)
-
Reporting lines are clear (no “floating” roles)
-
Authority is realistic (e.g., who approves method statements, ITPs, RFIs, NCR closures)
-
The structure matches the project’s scope/complexity (you can’t staff a mega job like a small fit-out)
Always Manage your tender - Review before submitting
Contract and Legal Aspects of Submitting an Org Chart
In many contracts and tender conditions, the submitted org chart + CVs can become a binding commitment (or at least a formal representation relied upon by the client). Practically, this affects:
1) “Key Personnel” obligations
Contracts often define Key Personnel (or “Key Staff”). Typical rules:
-
The contractor must assign named personnel as submitted.
-
Replacements may require client approval.
-
The replacement must be equal or better in qualifications/experience.
2) Qualification and completeness
Clients may require:
-
Every box filled (no placeholders like “TBD”)
-
Minimum years of experience
-
Mandatory certifications (common for HSE, QA/QC, specialized disciplines)
3) CVs and interviews
CVs are often required to prove competence and compliance with tender criteria. Interviews may be used to confirm:
-
the person is real/available,
-
understands the project constraints,
-
can manage stakeholders and contract requirements.
4) Contract risk if the chart is wrong
If you submit an org chart that is incomplete, unclear, or unrealistic, it can lead to:
-
tender rejection (non-compliance),
-
delayed award/approval,
-
disputes later (“you committed to this structure and these people”),
-
project performance issues (especially QA/QC, HSE, planning, and commercial control).
Practical rule: treat the tender org chart like a contractual deliverable—only promise what you can actually staff and support.
What a Good Project Org Chart Must Include
At minimum, most projects expect visibility of these functions (titles vary by country/client):
Leadership & management
-
Project Director (if applicable)
-
Project Manager
-
Construction Manager / Site Manager
Engineering & delivery
-
Discipline Engineers (Civil/Arch/MEP as applicable)
-
Section Engineers / Area Leads
-
Site Supervisors / General Foremen / Foremen
Planning & controls
-
Planning Engineer / Scheduler
-
Cost Control (if separate from QS/commercial)
-
Progress reporting interface (weekly/monthly)
Commercial
-
Quantity Surveyor / Commercial Manager
-
Contracts Administrator (if separate)
Quality
-
QA/QC Manager
-
Inspectors / Materials Engineer (if needed)
-
Document Control (often critical for QA/QC flow)
HSE
-
HSE Manager / Safety Officer(s)
Interfaces
-
Client/PMO/PMC interface
-
Engineer/Consultant supervision interface
-
Subcontractors (either shown under packages or under construction)
Governance vs Reporting
These terms are often mixed up (and they’re also strong SEO keywords):
-
Reporting structure: who reports to whom day-to-day (operational chain).
-
Management structure: who manages execution (planning, construction, resources).
-
Governance structure: who sets oversight, approvals, and control gates (e.g., corporate directors, steering committee, client leadership, approval boards).
A clear org chart usually shows reporting and management. Governance can be shown as:
-
a top row (steering/oversight), or
-
a separate “governance chart” for large projects.
How to Build an Org Chart Step-by-Step
-
Choose the chart type (project vs matrix vs site) based on what the client asks.
-
List mandatory functions (QA/QC, HSE, planning, commercial, document control).
-
Define work breakdown (zones/levels/packages) and assign area leads.
-
Assign names (avoid “TBD” if the tender requires named staff).
-
Draw reporting lines (solid line for direct reporting, dotted line for functional oversight).
-
Add interfaces (client/engineer/PMC/subcontractors).
-
Attach CVs (and certificates) for key roles if required.
-
Version control it (Rev 0 tender, Rev 1 award, Rev 2 mobilization, etc.).
Responsibility Matrix (RACI) vs Org Chart
An org chart shows who reports to whom. A RACI matrix shows who does what.
Use both when:
-
responsibilities overlap (QA/QC vs construction vs consultant),
-
approvals are strict (ITPs, MIRs, WIRs, NCR closures),
-
you want to prevent “not my job” disputes.
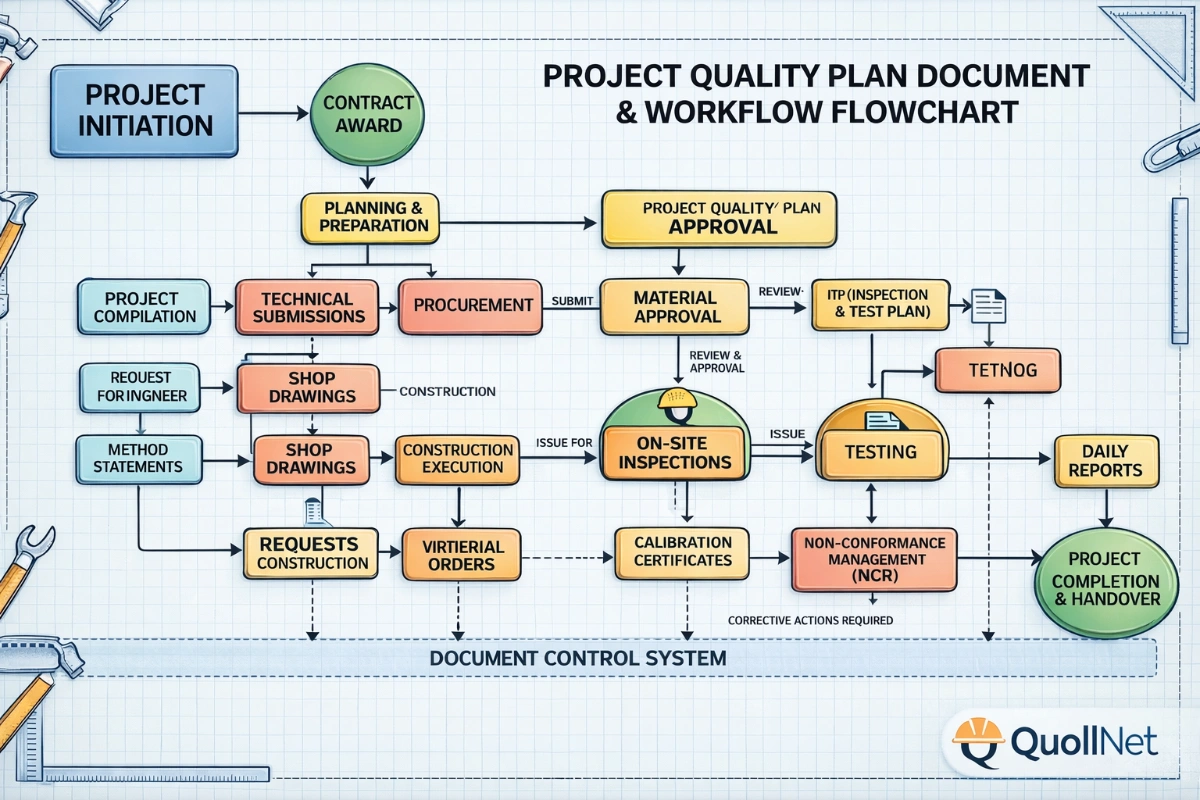
Good practice: reference the RACI in your Project Quality Plan / PMP and keep the org chart clean.
Typical Org Chart by Project Size
Small projects
Roles are often combined (e.g., PM also manages planning; QA/QC may be shared).
Risk: quality and documentation suffer if document control and QA/QC are not visible.
Medium projects
Clear separation of PM, site management, QA/QC, HSE, planning, and commercial.
Often includes discipline/area leads.
Large / complex projects
Matrix structure is common: strong corporate support + dedicated project controls + package managers.
Governance is usually formal (approval gates, key staff restrictions, structured reporting).
Do’s and Don’ts
Do
-
Match the org chart to the contract scope, program, and risk profile.
-
Show clear authority (who approves, who directs, who escalates).
-
Use realistic staffing (don’t promise a structure you can’t mobilize).
-
Keep it updated and issue revisions formally when the team changes.
-
Make key interfaces visible (client/engineer/PMC and major subcontractors).
Don’t
-
Leave empty boxes or placeholders in a tender that requires named personnel.
-
Create a matrix chart that hides who actually has site authority.
-
Overcomplicate the chart (too many dotted lines = confusion).
-
Forget document control, QA/QC, HSE, and planning—clients notice.
-
Treat it as a “graphic only” document; it’s often audited.
Corporate Organization Chart Example - Construction Companies
-
Corporate Org Chart Excel Template (editable): Excel organization chart template corporate
- Corporate Org Chart PDF Template (printable): PDF organization chart template corporate
 Corporate Organization Chart for Construction Companies